Turn anything into
a beautiful infographic
Paste a link or describe your idea.
Get an on-brand infographic in two minutes.
Create one freeNo card needed

no design skills needed
How it works
01
Drop a link
Paste the link to any video or blog post you want to repurpose. Simple prompts work also.
02
Match your brand
Paste the link to any website. We pull in its fonts and colors.
03
Download your infographic
Designed to be shared, sized for your platform of choice.
Examples
YouTubeColin & Samir: 10 harsh YouTube lessons
→ 1:1
PromptPrompt: SXSW Austin map
→ 16:9
ArticleChannels of Growth conference marketing playbook
→ 9:16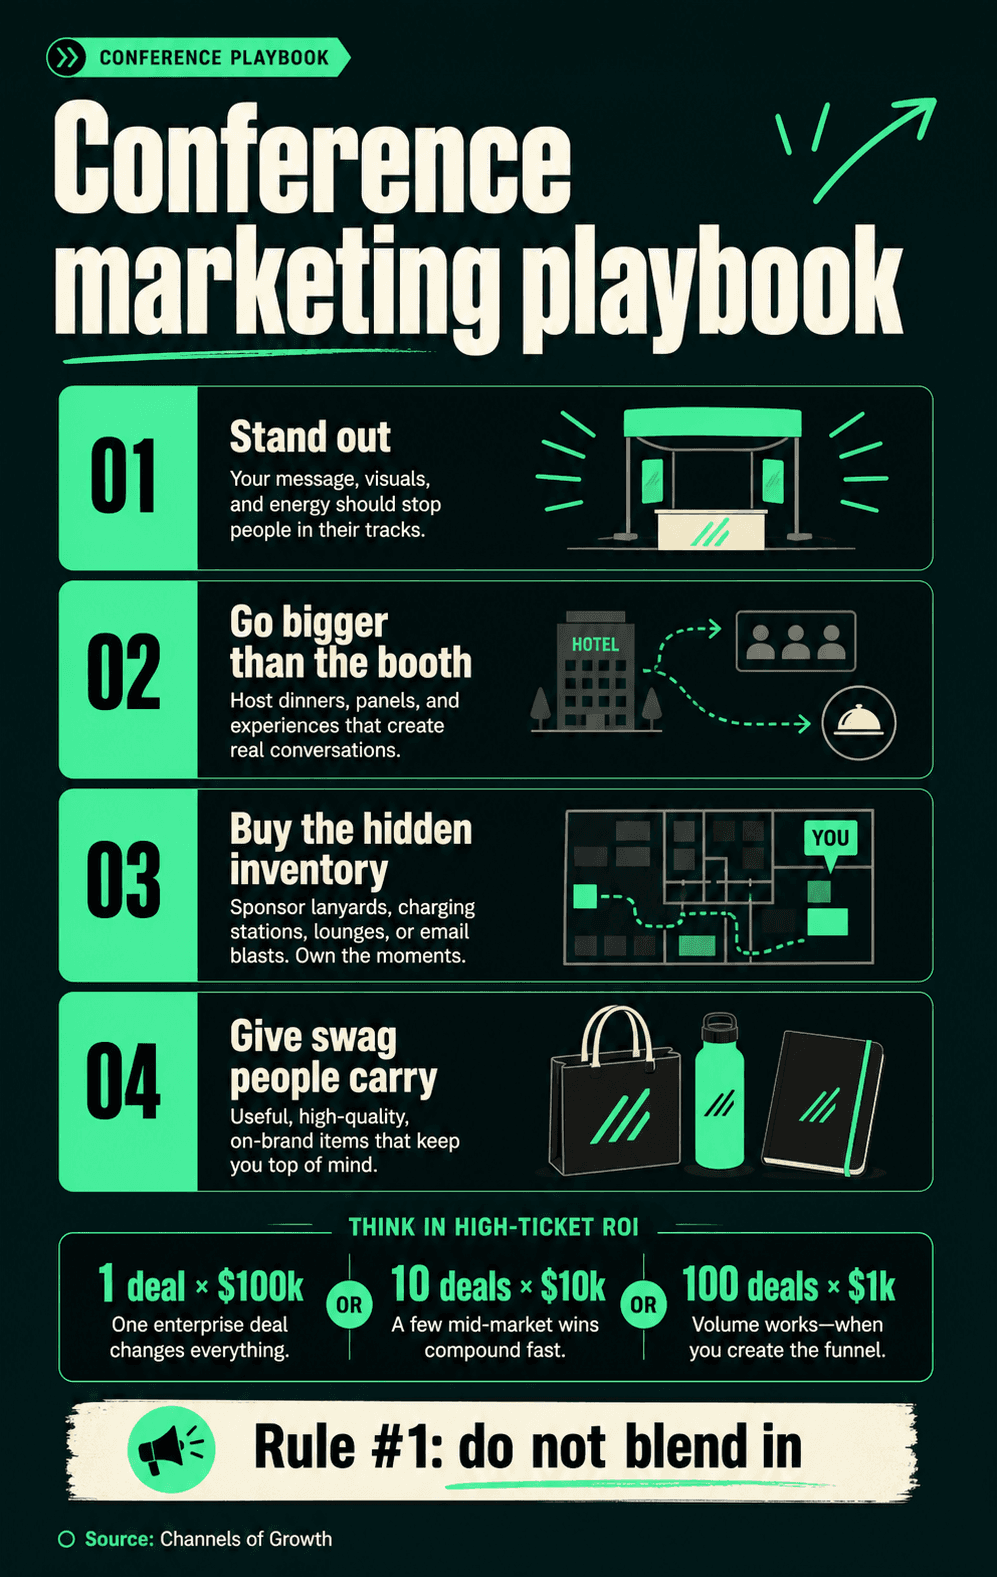
ArticleSparkToro zero-click search study
→ 9:16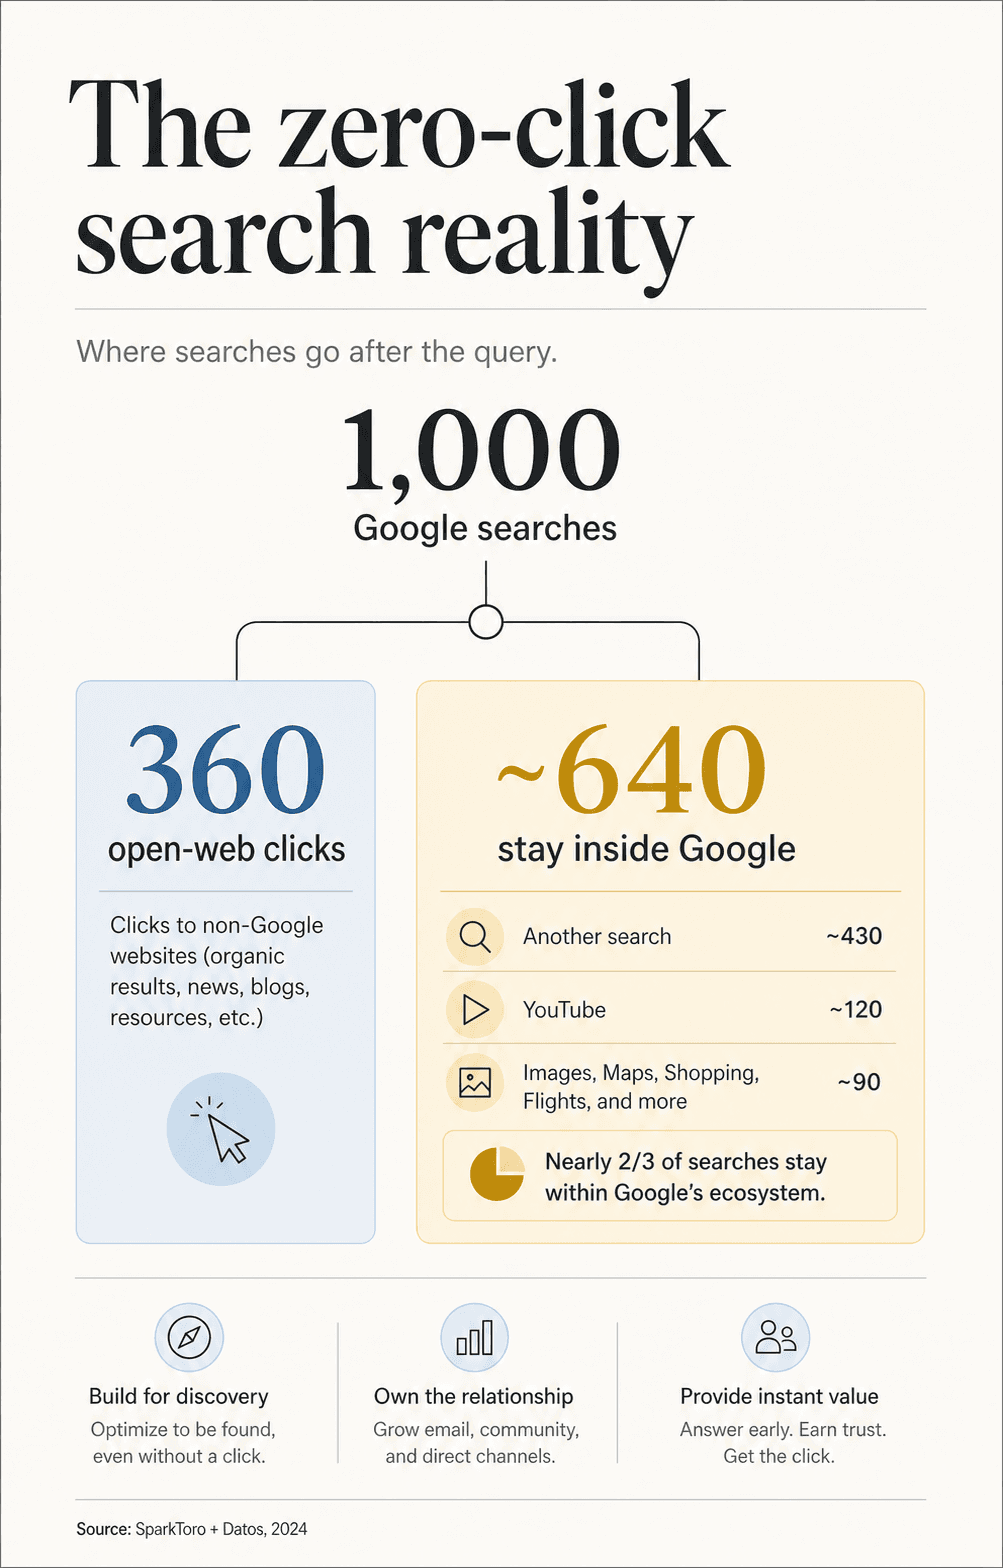
ArticleAdam Grant: What AI companions are missing
→ 1:1
Pricing
Creator
$19/ mo
- 50 credits / month
- Carousels
- 3 brand profiles
Pro
$39/ mo
- 150 credits / month
- Priority queue
- Unlimited brands
Annual: 20% off. Top-ups: $9 / 25 credits · $25 / 100 · $79 / 400.
For agentsComing soon
Use it from the tools you already work in.
Call AirGraphic from Claude/Claude Code, Codex/ChatGPT, or any agent via MCP, CLI, or HTTP. Public API and OpenAPI spec ship next.
Claude CodeCursorChatGPTCodex CLIMCPHTTP API
FAQ
Common questions.
What kinds of sources work?
Public blog posts, YouTube videos, TikTok clips, Instagram Reels, and newsletters that allow scraping. You can also type a prompt directly, no link required.
How does brand matching work?
Paste any website (yours, a portfolio, a competitor) and we pull the fonts and dominant colors. Save brand profiles to reuse them across generations.
What sizes and formats do I get?
LinkedIn carousel slides (4:5), LinkedIn and Instagram feed posts (1:1), Stories/Reels/Shorts (9:16), blog headers (16:9), and custom aspect ratios. Output as PNG, JPEG, or WebP.
Who owns these infographics?
You do. AirGraphic only generates from sources you have the right to use, and the resulting image is yours to publish.
How does pricing work?
Free plans get 5 one-time credits. Creator and Pro renew monthly. One credit = one infographic; carousels charge one credit per slide. Paid plans aren't live yet — the free plan is available now.
Is there an API?
The HTTP API ships next, with an OpenAPI spec and per-key rate limits. Today the web app is the way in.